Mastock Only
Candlestick Charting Techniques
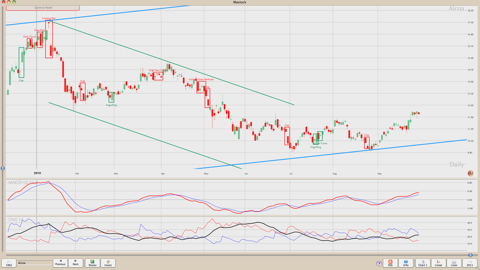
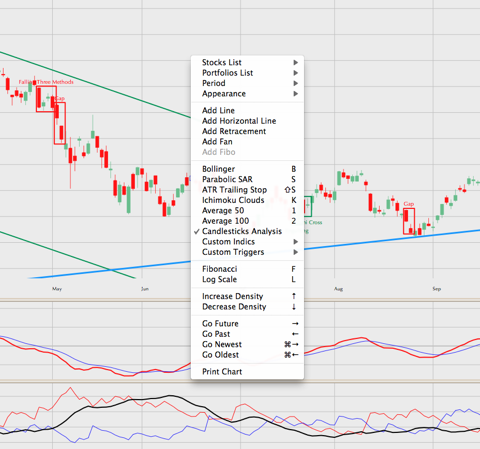
Japanese candlesticks analysis can be accessed through the menu View, Candlesticks Analysis or through the charts contextual menu.
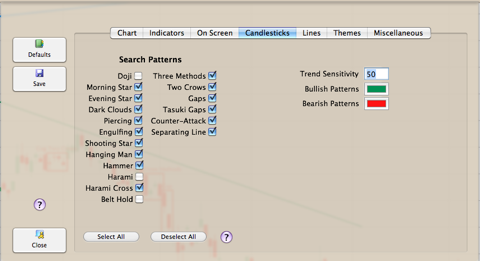
The preferences panel enables you to select the patterns you want to look for, as well as how sensitive do you want to be to the trend. Japanese candlesticks patterns are only significant when associated with a trend. The effective range for the trend option is somewhere between 40 and 80. Going lower will produce false alerts. Going higher might lead to ignore significant patterns. It’s up to the user to define which set of patterns and trend setting he/she is comfortable with.
The rectangles on the screen highlight the patterns. Green is bullish. Red is bearish. The name, below or above the rectangle, tells you what pattern was detected.