
The point and figures panel can be accessed through the View menu or by pressing X on the keyboard.
Options, like colors, are directly accessible on the bottom part of the chart.
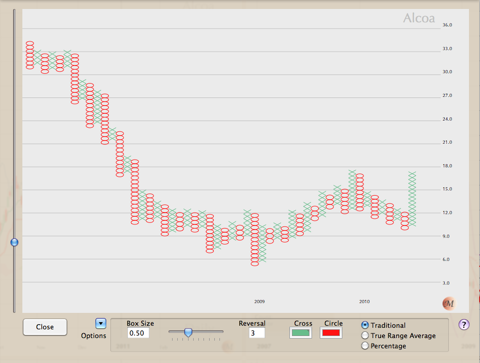
The box size is calculated based on the Average True Range over the last 20 days. You can, however, vary +/- 50% using the slider.
Reversal is the number of box sizes it takes to declare the trend has changed. You can directly edit it in the textfield. The range is limited between 1 and 5 with a default set to 3.