
Mastock Only
Defining Custom Indicators is done using the custom indicators panel. It is accessed through “Tools, Manage Triggers” or by using the “Z” keyboard shortcut.
How To - Step by Step
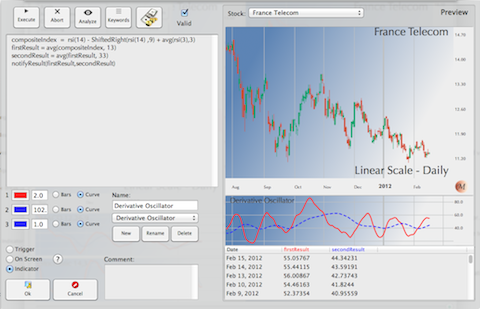
On the right side, the preview windows enable an instant check of either the program works or not. On the left side, the program instructions text and various control to define the type of indicator, color and thickness of the curves.
This panel enables you to define three kind of custom indicators:
- Indicator: Classical indicator displayed in the indicator view
- On Screen: Overlay in the graph view, like Bollinger bands
- Trigger: Display, on the graph, symbols for Buy and Sell recommendations
At the bottom of the left side, you can enter any comments you want to explain the meaning or any other relevant information for the current indicator.
Indicators or On Screen overlays can display up to 3 different curves. The three color wells on the left side define the colors for each of the curve. The text fields, nearby, define the thickness of each of the curves. Curve1 and Curve2 can either be bar chart or a simple curve.
To define a new indicator, press “New”, enter a name, pick the type, enter your text in the instruction area and, optionally, in the comments area.
The trigger effectiveness button starts a simulator showing what would have been the result, in cash, if you had strictly applied the system recommendations, over the last 12 months, on the current stock.