
Step 1:
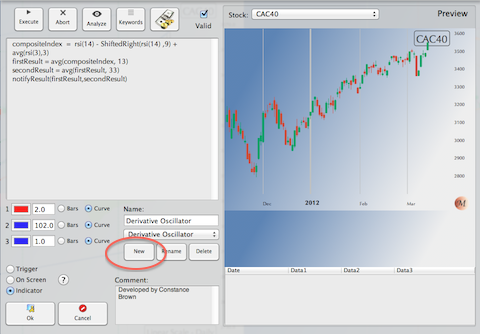
Most of the time, it’s easier to start from a pre-loaded script you want to modify, adapt to a specific problem to resolve. In order to do that, open the custom indicator panel, using the menu Indicators or the « Z » keyboard shortcut.
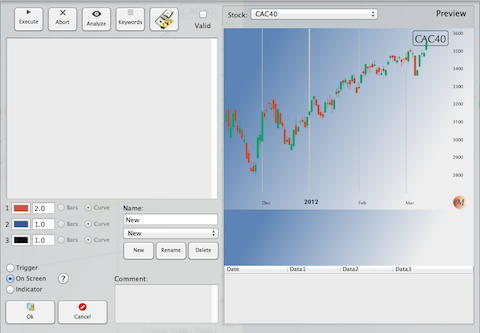
Press the button « New ». You should now see a blank text field, and the name of the new indicator, arbitrarily set to « New ».
Step 2:
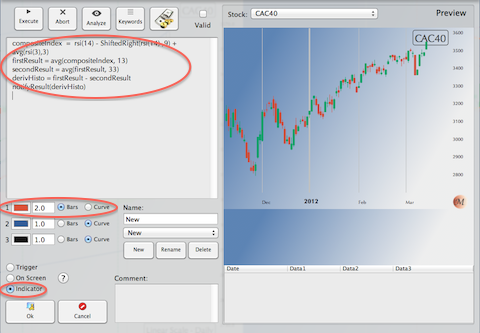
Copy and paste the original script into the blank text field.
Make sure you select the right configuration: In this particular case, we’re going to modify the Derivative Oscillator to display an histogram rather than two curves. We select « bar » and we select « indicator ».
We could have changed the color by clicking on the color well, but let’s say Red is fine.
Modify the script.
In this case, we replaced:
notifyResult(firstResult,secondResult)
by:
derivHisto = firstResult - secondResult
notifyResult(derivHisto)
Step 3:
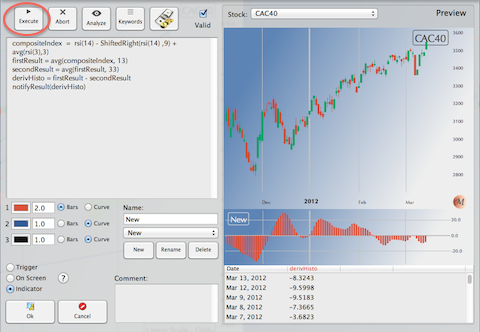
Time to test how smart we are… Just press the « Execute » button.
If the script is right, you should see the result in the preview area, on the right of the panel.
Step 4:
There is no step 4… Just press the « Ok » button. The « New » indicator should now appear in all the menus.