
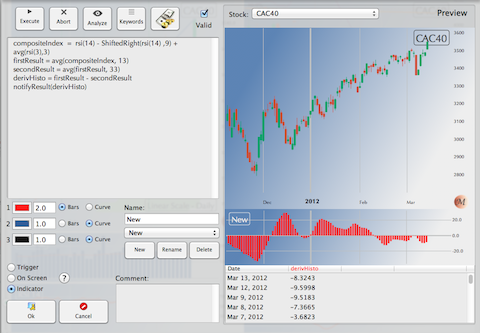
Let’s say you have a working indicator but you’re not satisfied with the way it looks.
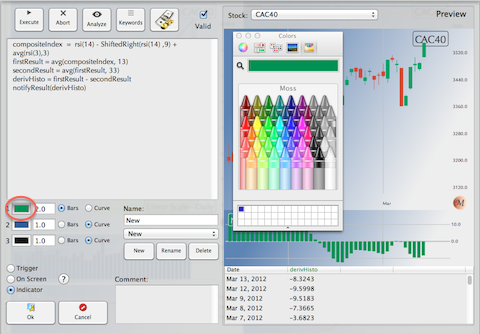
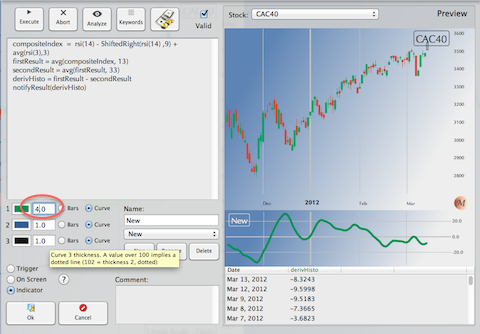
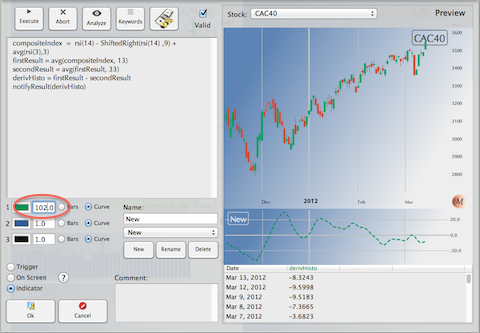
Step 1:
You can change the color by clicking on the color well. You should see a small color panel pop up where you can select the color you like.
You can change from a bar display to a curve and you can select the thickness of the curve.
Finally, if you set the thickness to a number greater than 100, the program will display a dotted line. For instance, a 102.5 thickness is a dotted line 2.5 thick.
Step 2:
Just press Ok…