Three-Line Break
 

The three-line break panel can be accessed through the View menu or by pressing Shift-X on the keyboard.


Screen shot 2011-07-26 at 9.34.57 PM

History These charts originates from Japan and gets its name from the default number of line blocks typically used. They use an up block (line), a down block (line) and a reversal block (line). These charts disregards the time factor, which is usually plotted on the X axis, in commonly used stock charts.
Theory Using the closing price, a new white (or blue) block is added in a new column if the previous high price is exceeded. A new black (or red) block is drawn if the close makes a new low. If there is neither a new high or low, nothing is drawn.
With a default Three Line Break, if a rally is powerful enough to form three or more consecutive white blocks, then the low of the last three white blocks must be exceeded before a black block is drawn. If a sell off is powerful enough to form three or more consecutive black blocks, then the high of the last three black blocks must be exceeded before a white block is drawn.
Construction To draw the blocks, today's close is compared to the high and low of the previous block. A block is drawn only when today's close exceeds the high or low of the previous block. If today's close is higher than the top of the previous block, a new white (or blue) block is drawn in the next column from the prior high to the new high price. If today's close is lower than the bottom of the previous block, a new black (or red) block is drawn in the next column from the prior low to the new low price. If the close fails to move outside the range of the previous blocks high or low, then nothing is drawn.
With the default Three Line Break chart, a downside reversal (i.e., white blocks change to black blocks) occurs when the price moves under the lowest price of the last three consecutive white blocks. A black reversal block is drawn from the bottom of the highest white block to the new price.
An upside reversal (i.e., black blocks change to white blocks) occurs when the price moves above the highest price of the last three consecutive black blocks. A white reversal block is drawn from the top of the lowest black block to the new high price.
Study the Three line Break chart given below and compare it with the bar
threelinebreak.png

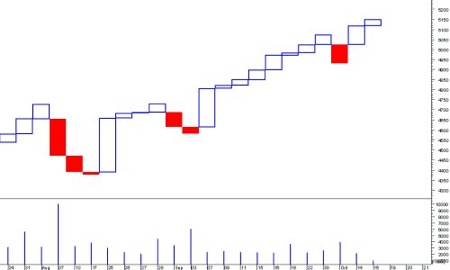
Three Line Break Charts are stock charts used in charting and study of chart patterns in technical analysis.
barchart.png
This bar chart is for the comparison. It belongs to the same stock and time period.