
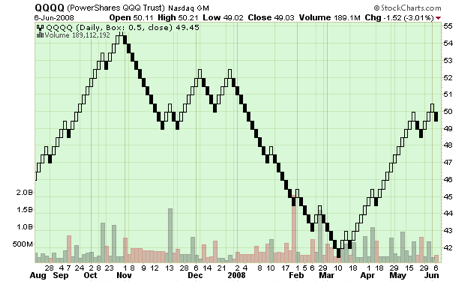
Renko charts are price charts with rising and falling diagonal lines of boxes that are either filled or hollow. Renko charts are "time independent" charts that do not have constantly spaced time axes. Here is an example of a Renko chart:
The word "Renko" comes from "Renga", the Japanese word for "brick". The filled and hollow squares that make up a Renko chart are often referred to as "bricks." Renko charts were popularized by Steve Nison in his book Beyond Candlesticks.
Renko charts have a pre-determined "Brick Size" that is used to determine when new bricks are added to the chart. If prices move more than the Brick Size above the top (or below the bottom) of the last brick on the chart, a new brick is added in the next chart column. Hollow bricks are added if prices are rising. Black bricks are added if prices are falling. Only one type of brick can be added per time period. Bricks are always with their corners touching and no more than one brick may occupy each chart column.
It's important to note that prices may exceed the top (or bottom) of the current brick. Again, new bricks are only added when prices completely "fill" the brick. For example, for a 5-point chart, if prices rise from 98 to 102, the hollow brick that goes from 95 to 100 is added to the chart BUT the hollow brick that goes from 100 to 105 is NOT DRAWN. The Renko chart will give the impression that prices stopped at 100.
It's also important to remember that Renko charts may not change for several time periods. Prices have to rise or fall "significantly" in order for bricks to be added.
Interpretation
Hollow bricks are bullish, black bricks are bearish - that's the simplest interpretation of Renko charts. Renko charts may be most useful in identifying trends and trend direction. Because they screen out moves that are less than the Brick size, trends are much easier to spot and follow. In order to avoid whiplash periods, some people wait unto 2 or 3 bricks appear in a new direction before taking a position.
Parameters
There are two ways to specify the Brick Size for a Renko chart: Absolute Points and Average True Range (ATR). In addition, you can specify whether closing prices or high/low prices are used.
Absolute Points
With the "Absolute Points" method, you specify the size of each brick on the chart in points. The advantage of this method is that it is very easy to understand and predict when new bricks will appear. The disadvantage is that the point value needs to be different for high priced stocks than for low priced stocks. Typically you will need to choose a value that is roughly 1/20th the average price of the stock during the time frame you want to chart. Common values include 1, 2, 4, and 10.
Important Note: The Default for the "Pts" method is currently 14 which is too large for most stocks. You'll need to change it to a smaller number to get a useful chart.
Average True Range
The "Average True Range (ATR)" method uses the value of the ATR indicator to determine the brick size. The ATR indicator is designed to ignore the normal volatility of a stock and thus it can "automatically" find good brick sizes regardless of the value or volatility of the stock selected. ATR with a value of 14 is the default value for Renko charts and should generate a very usable chart in most cases.
Close Only
High/Low Prices
When using High/Low prices, it's important to note that the rules for drawing Renko charts favor hollow bricks. In other words, regardless of the current direction of the bricks, you first check to see if any new hollow bricks can be added to a chart and, if they can, you then stop without looking at the lows of the day.