
Kagi charts are price charts with thick and thin vertical lines connected by short horizontal lines. Just like P&F charts, Kagi charts only add a new vertical line when prices have reversed enough to cancel the current uptrend or downtrend. Until such a reversal occurs, a Kagi chart will only move up (or down) in its current column. Kagi charts do not have constantly spaced time axes. Here is an example of a Kagi chart:
The word "Kagi" comes from the Japanese art of woodblock printing. A kagi or "key" is the L-shaped guide in a woodblock that a printer used to line up the paper for printing. Because of this, Kagi charts are sometimes referred to as "Key charts." Kagi charts were popularized by Steve Nison in his book Beyond Candlesticks.
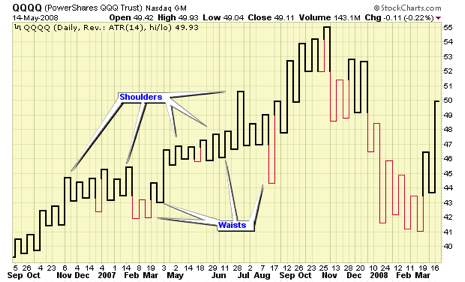
The thickness of the Kagi line changes depending on price action. The thick line is called the yang line and the thin line is called the yin line. The locations where the line changed from moving higher to moving lower are called "shoulders" and the locations where the line changed from moving lower to moving higher are called "waists". Whenever a yin (thin) line moves above the previous shoulder, it turns into a yang (thick) line. Similarly, whenever a yang line moves below the previous waist, it turns into a yin line.
The Kagi line will continue to move up (or down) until prices reverse by a specified amount. When that happens, a short horizontal line is added as well as a new vertical line which extends to the new closing price. There are several ways to specify the reversal amount - in absolute points, as a percentage, or by using the Average True Range of recent prices (see below for details).
Interpretation
The simplest way to interpret Kagi charts can be summed up by Steve Nison's expression Buy on yang, sell on yin. When the Kagi line goes from thin to thick, prices have just exceeded their previous important high - that's a bullish signal. The opposite is also true. When the Kagi line goes from thick to thin, prices have just fallen below their previous low, not a good sign for things to come.
Standard support/resistance, trend and chart pattern analysis techniques can also be used with Kagi charts. In fact it is often easier to locate strong support or resistance levels on Kagi charts because of their "clean" appearance.
Another interpretation technique mentioned by Steve Nison is to look for a sequence of nine (mostly consecutive) shoulders or waists. Traders look for strong counter-moves soon after the ninth shoulder or waist appears.
Parameters
There are three ways to specify the reversal amount that is used in the construction of a Kagi chart: Absolute points, Percentage, and Average True Range (ATR).
Absolute Points
With the "Absolute Points" method, you specify the number of points that a stock must reverse before a change in the Kagi line occurs. The advantage of this method is that it is very easy to understand and predict where reversals will occur. The disadvantage is that the point value needs to be different for high priced stocks than for low priced stocks. Typically you will need to choose a value that is roughly 1/20th the average price of the stock during the time frame you want to chart. Common values include 1, 2, 4, and 10.
Important Note: The Default for Kagi "Pts" method is currently 14 which is too large for most stocks. You'll need to change it to a smaller number to get a useful chart.
Percentage
The "Percentage" method causes a reversal each time prices move more that the percentage that you specified. This has the advantage of not needing to change the setting if the value of the stock changes significantly during the time period being charted. The disadvantage is that it isn't easy to predict exactly where the next reversal will occur.
Average True Range (ATR)
The "Average True Range (ATR)" method uses the value of the ATR indicator to determine where the next reversal should occur. The ATR indicator is designed to ignore the normal volatility of a stock and thus it can "automatically" find good reversal levels regardless of the value or volatility of the stock selected. ATR with a value of 14 is the default value for Kagi charts and should generate a very usable chart in most cases.