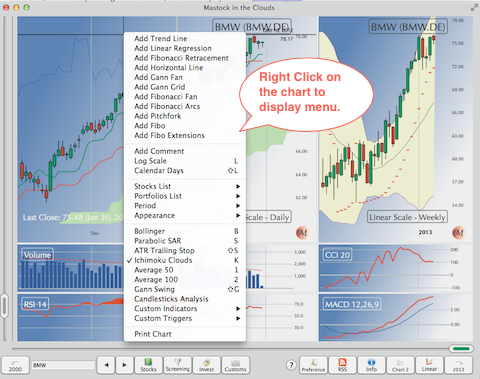
Main chart displays quotes for the current stock, for the selected period of time.
See Navigation to control what period of time, with what kind of scale, is displayed on the screen.
When moving the cursor horizontally, we can select a candlestick. That selected candlestick is used to display info or add a Line or Fibo. The selected candlestick color can be changed in the Preferences Panel.