
The density of candlesticks, on the chart, is controlled by 4 parameters available in the Preferences Panel.
The 4 parameters controlling the chart density:
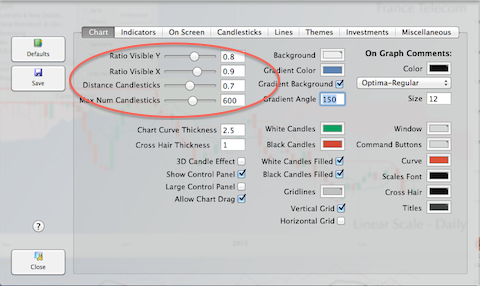
- Ratio Visible X: The percentage of the screen, horizontally, available to display candles. The unused space is concentrated on the right of the screen, defining the margin between the most recent quote and the right border.
- Ratio Visible Y: The percentage of the screen, vertically, available to display candles. The unused space is divided equally, defining the top and bottom margins for the chart.
- Max Number of Candlesticks: Defines the number of candlesticks displayed when the density slider is at 100%.
- Distance Candlesticks: Control the percentage of space between 2 candlesticks, compared to the overall space available for one candlestick. At min, candlesticks are touching each other without any space in between.
The density can also be controlled using the up and down arrow, or through the main Navigation menu or the Pop Up Chart menu.
Also, a mouse wheel scroll increases or decreases density depending on the rotation: Backward for decrease and Forward for increase.
Finally, a two fingers gesture, up or down, on the trackpad, increases or decreases the density by 4%.