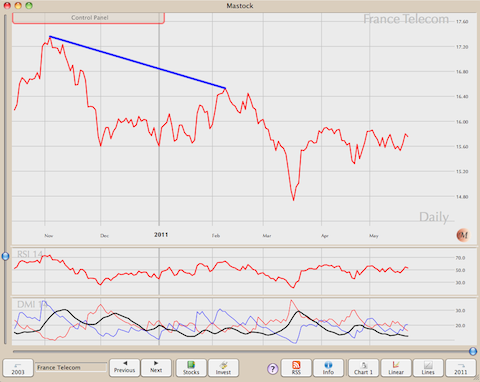
A Line is used to channel what could be a representation of an Elliott Wave. You can Add a new Line, using the Pop Up Chart menu (right-click, or space bar, or Option-click). Color can be used to distinguish between figures like zigzag, flat or others. You can also use the main “Lines&Comments” menu, at the top of the screen..
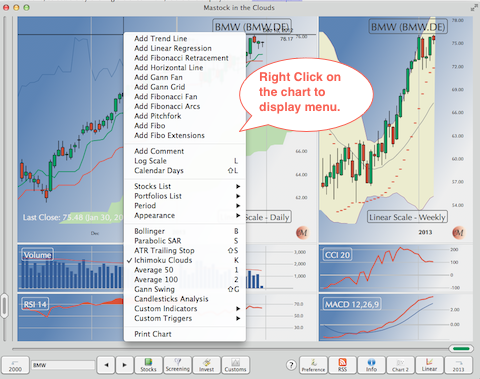
Gann Fans, Fibonacci Fans, Linear Regression, Pitchforks, Fibonacci Extensions, Gann Grid and Retracements are derivatives of Lines, showing Fibonacci Angles and Retracement values or reaction to Gann Angles.
When you create a line, the first click defines the pivot point, the second the slope. It’s important to remember the first point is significant as, when changing the slope, that first point will remain constant.
When you locate the mouse cursor near a line, you should see the color change, signaling it’s selected. From there, you can:
- Right-Click (or Option-Left Click, or just press Space) to display the contextual menu
- Left-Click to change the slope
- Shift-Left-Click to move the pivot point
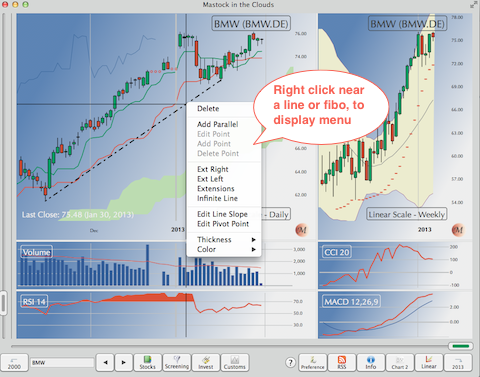
You can also add Horizontal lines with one click. The horizontal lines are created infinite. However, you can change the extensions as you would for any other lines.
One important point: Pay attention to the preference settings “Snap Lines to Chart” in the preferences panel. If unchecked, you can freely draw lines anywhere on the chart. If checked, the extremities of new lines are automatically adjusted to coincide with the high or low of the day (or Close if displaying a simple curve)
When, the snap line to chart preference is set to yes, and you select a day defining a line, the program will select the high or low of the day as the reference point if your display is, either Candlesticks or OHLC. It will select the Close value if your display is a simple curve.