
Mastock Only
The graph on the right represents your current status, the graph in the bottom represents the historical value of one or several portfolios
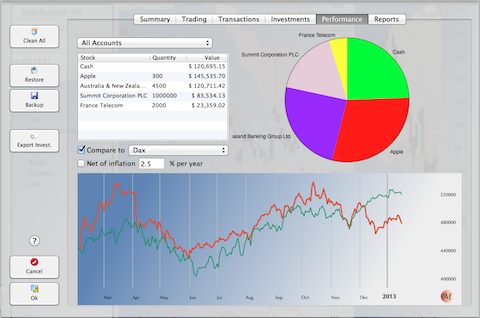
The historical graph is calculated using the default currency and the last known exchange rates. It means the performance exclusively reflects the performance of stocks independently of the exchange rates variations.